This is my detailed review of the Asus ROG Strix Scar 17 X3D, a powerful 17-inch laptop with unique specs in today’s notebook environment, as it pairs an AMD Ryzen 9 7945HX3D processor with an Nvidia RTX 4090 Laptop dGPU.
What makes this laptop unique is the fact that it is currently the only one to offer the AMD Ryzen 9 7945HX3D processor, which is the only AMD mobile processor with 3D V-Cache.
Now, if you’re familiar with AMD platforms, you’re most likely aware of the 3D V-Cache implementations in the Ryzen 5800X3D and Ryzen 7800X3D desktop processors, as well as the impact of this caching technology in games.
Back to the Ryzen 9 7945HX3D, this also promises to offer a significant boost in framerates. In fact, AMD claims this processor, paired with the RTX 4090 dGPU, makes the Scar 17 X3D the fastest gaming laptop that you can buy today.
With that in mind, we’ve put the laptop through its paces, tested its performance in benchmarks, workloads and games. I purposelly didn’t rush out the review, but instead waited for a few software updates that would smoothen any rough edges. And I’ll share my findings with you in this article.
Specs sheet as reviewed – Asus ROG Strix Scar 17 X3D
| 2023 ASUS ROG Strix SCAR 17 X3D G733PYV | |
| Display | 17.3-inch, 16:9, non-touch, matte, QHD+ 2560 x 1440 px, IPS, 240 Hz 3ms, 350-nits, 100% DCI-P3 |
| Processor | AMD Dragon Range HX, Ryzen 9 7945HX3D, 16C/32T, with 3D V-Cache |
| Video | Radeon + Nvidia GeForce RTX 4090 Laptop 16GB (up to 175W with Dynamic Boost), overclocked at 2090MHz on Turbo mode, with MUX, Advanced Optimus, GSync |
| Memory | 32 GB DDR5-4800 RAM – up to 64 GB (2x DIMMs) |
| Storage | 2TB SSD (SK Hynix PC801 drive) – 2x M.2 PCI 4.0 x4 slots |
| Connectivity | WiFi 6E (Mediatek MT7922) 2×2 with Bluetooth 5.2, 2.5Gigabit LAN |
| Ports | Back: power, 2.5G Lan, 2x USB-C gen2 (with video, data, power), HDMI 2.1 FRL Left: 2x USB-A 3.2 gen1, audio jack Right: no ports |
| Battery | 90Wh, 330 W power adapter, USB-C charging up to 100W |
| Size | 395 mm or 15.55” (w) x 282 mm or 11.10″ (d) x 23.4 – 28.3 mm or .92″ – 1.11″ (h) |
| Weight | 2.94 kg (6.48 lbs) + 1.12 kg (2.47 lbs) main power brick and cables, EU version |
| Extras | rubber-dome per-key RGB backlit keyboard with NumPad, HD camera, dual speakers, vapor-chamber cooling module |
This Scar 17 X3D G733PYV is identical to the Scar 17 G733PY that we’ve tested a few months ago, that one being a Ryzen 9 7945HX + RTX 4090 configuration.
THis X3D variant is only available with an RTX 4090 GPU, while the regular AMD Scar 17 can also be specced out more affordably in the Scar 17 G737PZ (R9 + RTX 4080).
Lower-tier specs (AMD + 4050 to 4070 GPUs) are not available for the 2023 Scar lineup, but are offered on the ROG Strix G17 G713P series. Here’s our review of the mid-tier Asus ROG Strix G17 model (Ryzen 9 7945HX + RTX 4070).
Design, inputs and display
Since the regular Scar 17 and this Scar 17 X3D are identical in every aspect aside from the bundled CPUs, I’ll refer you to our previous article for my thoughts on the design, ergonomics, inputs and the 17-inch display available on these notebooks.
In just a few words, this 2023 Scar 17 is based on the Scar 17 Special Edition chassis from last year, and is a full-size laptop (3 kilos + 1.1 for the charger) with a 17-inch 16:9 display, a full-sized RGB keyboard, plenty of ports, and a beefy thermal module with a large vapor-chamber.
While alright overall, ergonomically, this design leaves some to be desired, with the limited screen back angle, the IO placement and the way the status LEDs are annoyingly positioned under the display.
Furthermore, this series doesn’t offer the larger and brighter 16:10 panels available with the Scar 18 design, and is still a mostly plastic chassis, which helps the laptop keep cooler under load, but might not satisfy the requirements of some of you, especially considering the 3.5+K price that Asus are asking for this laptop.
")
Asus ROG Strix Scar 17 review
Hardware and performance
Our test model is the only available configuration of the Asus ROG Strix Scar 17 X3D, code name G733PYV, built on an AMD Ryzen 9 7945HX3D processor, 32 GB of DDR5-4800 memory, 1 TB of SSD storage, and dual graphics: the Nvidia RTX 4090 16GB dGPU and the Radeon iGPU integrated within the AMD processor.
Before we proceed, keep in mind that our review unit is a pre-release sample and was sent over by AMD for this review. However, since I haven’t published the article at the NDA date, it runs on the mature software available as of mid-September 2023 (BIOS 324, Armoury Crate 5.6.10, GeForce 537.13 drivers). I expect little to further change with later software at this point.
Spec-wise, this 2023 Asus ROG Strix Scar 17 X3D is built on the latest AMD and Nvidia hardware available to date.
The Ryzen 9 7945HX3D is the unique selling point of this series. It’s still part of the Ryzen 7000 Dragon Range platform, just like the non-3D Ryzen 9 7945HX, built on a Zen4 architecture and with 16 Cores and 32 Threads.
But it implements 3D V-Cache, which is an extra 64 MB of L3 cache over what the regular 7945HX offers, for a total of 144 MB of total cache (vs 80 MB on the regular processor).
")
Design wise, the extra cache is physically layered on top one of the two CPU chiplets that make for the 7945HX3D processor. For that, AMD had to make one of the chiplets a little slimmer, to create the extra space for the cache on top, and still end up with a processor identical in size to the regular 7945HX.
This design also means that only 8 of the 16 Cores benefit from the extra V-Cache, while the other 8 are similar to the ones in the regular CPU. That’s why the software is going to play an important role in the implementation of this 3D CPU, as it has to assign each load to the right core in order to squeeze the best performance out of this hardware.
One other important detail that must be added is the need for the V-cache enabled chiplet to run more efficiently than the non-V-cache chiplet, in order to prevent any overheating. We’ll get in depth on this aspect down below in the review, when comparing this 7945HX3D implementation to the regular 7945HX in CPU heavy workloads.
With that out of the way, the remainder of the specs are identical between the two Scar 17 2023 units. These include an RTX 4090 dGPU that goes up to 175W TGP with Dynamic Boost and implements a MUX.
There are also 32 GB of RAM on this laptop, and Asus only offers DDR5-4800 memory – I’d be curious to test out the impact of adding faster DDR5-5600 memory on this platform. Anyway, the memory can be upgraded, as there are two DIMM slots inside.
For storage, there are two M.2 2280 SSD slots inside as well, and our unit came with a premium-tier 1 TB Samsung PM9A1 drive.
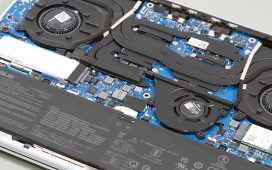
Getting inside to the components is a fairly simple task. For that, you need to take out the bottom D-panel, held in place by a few Philips screws. There’s a pop-up screw in the right corner that will help you in the process and will allow you to work your way around the device with a plastic prying tool.
Be careful, though, this is the same design as on prior 2021/2022 Strix models that integrates the lightbar into the d-Panel, so don’t pull too hard on the cover or you’ll sever the ribbon connection between the motherboard and the lightbar. It’s not going to be the end of the world if it still happens, though, you’ll just have to reslot the ribbons into their connectors.
Inside you get unrestrained access to the RAM slot, the SSD slots, the WiFi module, battery, speakers, and thermal module. This design implements a Vapor Chamber cooling module, and there’s still some unused space inside the chassis, a result of it being repurposed from the 2022 Scar 17 SE model.
Down below I’ve included a picture of the internals on the regular Scar 17 G733PY, but the PYV model tested here is just the same.
")
Specs aside, Asus offer their standard power profiles in the Armoury Crate control app: Silent, Performance, Turbo, and Manual, with various power settings and fan profiles between them, summarized in the following table.
| Silent | Performance | Turbo | Manual + max fans | |
| CPU only, SPL/SPPT TDP | 55/65W | 85/90W | 90/125W | 100/125W |
| GPU only, max TGP | 55W | 160W | 175W | 175W |
| Crossload Max GPU TDP + GPU TGP |
85W, 30 + 55W | 190W, 40 + 150W | 225W, 50 + 175W | 235W, 60 + 175W |
| Noise at head-level, tested | ~35 dBA | ~44 dBA | ~48 dBA | ~53 dBA, max fans |
Aside from these main power profiles, there are also some GPU options to choose from: Ultimate (dGPU only, requires a restart when selected), Standard (enables Advanced Optimus), Optimized (enables regular Optimus), and Eco (regular Optimus, but disables the dGPU). I mostly kept the laptop on Standard for daily use and tests, and opted for Ultimate for gaming.
Before we jump to the performance section, here’s how this laptop handles everyday use and multitasking on the Silent profile, unplugged from the wall. For what is worth, the fans spin slowly and quietly (sub 25DbA) on this Silent mode with casual use, but they only idle with the lightest of loads, as otherwise browsing or daily multitasking activities push the CPU over the 60 degrees C limit and wake up both fans.
Performance and benchmarks
On to more demanding loads, we start by testing the CPU’s performance by running the Cinebench R15 test for 15+ times in a loop, with a 1-2 seconds delay between each run.
The AMD Ryzen 9 processor stabilizes at ~105W of sustained power on the Turbo setting, with the laptop flat on the desk, with temperatures of around 88 C and scores of around 5200-5300 points. The fans spin at ~48 dB at head level in this mode.
The CPU is thermally limited in this implementation, with the limit set at around 90 degrees Celsius. As a result, it powers down in order to stay within this limit. That means bumping the back of the laptop off the desk will allow for slightly higher sustained power.
PBO (Precision Boost Overdrive) control is offered in the BIOS, which allows to undervolt the processor. However, I didn’t get to test this on this unit.
There’s also the option of using the Manual profile and ramping the fans to 100% rpms, while still having the back bumped off the desk. The noise levels jump to around 53-54 dBA in this case, and the sustained power stabilizes at around 115W in this test. The scores increase by 3-5% as well.
Switching over to the Performance profile translates in the CPU stabilizing at a little over 90W and still similar temperatures in the high-80s, with the fans spinning quieter at ~43 dBA at head-level. That’s with the laptop on the desk.
On the Silent profile, the CPU stabilizes at around 65W, with barely audible fans (sub 35 dB) and temperatures in the low-80s C. The R9-7945HX3D still scores around 4400 points in this mode, about 80-85% of the Turbo performance.
Finally, the CPU runs at 60W sustained on the Performance mode, on batter power, allowing for excellent results in this particular test. Details below.
")
Overall, this AMD Ryzen 9 7945HX3D is one of the fastest mobile processor in this sort of multi-threaded load. However, Asus thermally caps the CPU on this unit, not allowing it to go over 90 degrees Celsius, and as a result the scores end up a little lower than on the Ryzen 9 7y945HX units tested earlier, both the Scar 17 and the Strix G17. On those units, the system allows the processors to run at 95+ degrees Celsius.
On the Silent modes, however, the 7945HX3D and the 7945HX perform similarly, all being limited to around 67W. At lower power, the 3D processor should end up at a slightly advantage over the regular HX processor, based on the specs at least.
")
As far as the other mobile CPUs go, the Intel Core i9-13980HX implemented in competing products is about 10% slower on default settings, and comes up to within 5% if undervolted in the Scar 18, but it runs at significantly higher power than the AMD processor. The i9-13900HX implemented in many other performance laptops comes out about on par with the 13980HX at 150W in the Alienware m16, but also at about 80% of the performance of the Ryzen processor at around 100W, in the Lenovo Legion Pro 7i or the Razer Blade 16.
The gap in performance between the Ryzen and Intel platforms gets bigger at lower power, on the Silent profiles. At around 70W, the AMD Ryzen 9 processor is 20% faster than the Intel i9, and the gap widens as we go even lower in power.
") Furthermore, it’s also worth adding that the 2023 AMD Dragon Range processors are more the twice the performance of the Ryzen 9 6900HX CPU in this test, previously the fastest AMD platform of the past hardware generation. That’s a huge leap in YoY performance.
Furthermore, it’s also worth adding that the 2023 AMD Dragon Range processors are more the twice the performance of the Ryzen 9 6900HX CPU in this test, previously the fastest AMD platform of the past hardware generation. That’s a huge leap in YoY performance.
We then went ahead and further verified our findings with the more taxing Cinebench R23 loop test and Blender – Classroom, which resulted in similar findings to those explained above, with one exception: the power stabilizes at around 55-57W on Silent, in these longer-duration loads..
We also ran the 3DMark CPU test on the Turbo profile.
Finally, we ran our combined CPU+GPU stress tests on this notebook. 3DMark stress runs the same test for 20 times in a loop and looks for performance variation and degradation over time, and this unit passed it fine, albeit by a small limit, both when kept flat on the desk or when placed on a raiser stand. This means the performance is not impacted as the heat builds up with longer-duration sustained mixed loads.
Next, we ran the entire suite of tests and benchmarks, on the Turbo profile with the GPU set on the Standard mode (MUX on Advanced Optimus), and with the screen set at the native QHD resolution.
Here’s what we got:
- 3DMark 13 – CPU profile: max – 13207, 16 – 13095, 8 – 7453, 4 – 4107, 2 – 2154, 1 – 1083;
- 3DMark 13 – Fire Strike (DX11): 42707 (Graphics – 52038, Physics – 39053, Combined – 19374);
- 3DMark 13 – Port Royal (RTX): 13756;
- 3DMark 13 – Time Spy (DX12): 20485 (Graphics – 22122, CPU – 14433);
- 3DMark 13 – Speed Way (DX12 Ultimate): 5667;
- Uniengine Superposition – 1080p Extreme: 13133;
- Uniengine Superposition – 1080p Medium: 35829;
- Handbrake 1.3.3 (4K to 1080p encode): 73.89 average fps;
- Handbrake 1.6.1 (4K to 1080p encode): 105.61 average fps;
- PCMark 10: 9144 (Essentials – 12259, Productivity – 11387, Digital Content Creation – 14863);
- GeekBench 5.5.1 64-bit: Multi-core: 19854, Single-Core: 2134;
- GeekBench 6.0.2: Multi-core: 16119, Single-Core: 2754;
- CineBench R15 (best run): CPU 5501 cb, CPU Single Core 308 cb;
- CineBench R20 (best run): CPU 12892 cb, CPU Single Core 754 cb;
- CineBench R23: CPU 34075 cb (best single run), CPU 32041 cb (10 min run), CPU Single Core 1946 cb;
- x265 HD Benchmark 64-bit: 17.09 s.
And here are some workstation benchmarks, on the same Turbo profile:
- Blender 3.01 – BMW scene – CPU Compute: 1m 12s ;
- Blender 3.01 – BMW scene – GPU Compute: 10.18s (CUDA), 5.85s (Optix);
- Blender 3.01 – Classroom scene – CPU Compute: 2m 36s;
- Blender 3.01 – Classroom scene – GPU Compute: 18.99s (CUDA), 12.26s (Optix);
- Blender 3.41 – BMW scene – CPU Compute: 1m 11s;
- Blender 3.41 – BMW scene – GPU Compute: 9.41s (CUDA), 6.04 (Optix);
- Blender 3.41 – Classroom scene – CPU Compute: 2m 38s;
- Blender 3.41 – Classroom scene – GPU Compute: 16.97s (CUDA), 9.47s (Optix);
- PugetBench – DaVinci Resolve: 2143 points;
- PugetBench – Adobe After Effects: 1142;
- PugetBench – Adobe Photoshop: 1326;
- PugetBench – Adobe Premiere: 896;
- SPECviewperf 2020 – 3DSMax: 212.43;
- SPECviewperf 2020 – Catia: 103.83;
- SPECviewperf 2020 – Creo: 127.37;
- SPECviewperf 2020 – Energy: 74.77;
- SPECviewperf 2020 – Maya: 552.36;
- SPECviewperf 2020 – Medical: 54.58;
- SPECviewperf 2020 – SNX: 35.16;
- SPECviewperf 2020 – SW: 433.55.
- V-Ray Benchmark: 25755- CPU, 2673 – CUDA, 3583 – RTX.
This is one of the fastest laptops we’ve tested this year and will handle everything smoothly, from daily multitasking to heavy workloads and gaming sessions.
It comes very close to the Ryzen 9 7945HX configurations we’ve tested earlier in the CPU tests, while compared to the Intel Core i9 HX alternatives, it beats those by about 10% in multi-threaded loads, but trails them by 10% as well in single-core performance.
On the GPU side, there’s hardly any notable difference between this RTX 4090 implementation and the other we’ve tested.
With mixed loads and work applications, though, this AMD configuration holds an advantage in CPU-heavy activities such as Blender, and trades blows with the Intel alternatives in most other loads. I’ve added a short comparison table down below, for an extra look at these platforms.
Ryzen 9 7945HX3D / 7945HX vs Core i9 13980HX / 13900HX performance
Here we go.
| R9-7945HX3D + 4090 175W 2023 ROG Scar 17 3D |
R9-7945HX + 4090 175W 2023 ROG Scar 17 |
i9-13980HX + 4090 175W 2023 ROG Scar 18 |
i9-13900HX + 4090 175W 2023 Legion Pro 7i |
|
| 3DMark – Fire Strike | 42707 (G – 52038, P – 39053, C – 19374) | 42293 (G – 51260, P – 39906, C – 19033) | 36036 (G – 47622, P – 40243, C – 12087) | 35744 (G – 47175, P – 38696, C – 11193) |
| 3DMark – Port Royal | 13756 | 14105 | 13564 | 14063 |
| 3DMark – Time Spy | 20485 (Graphics – 22122, CPU – 14433) | 19711 (Graphics – 22168, CPU – 12260) | 20350 (Graphics – 21222, CPU – 16509) | 20953 (Graphics – 21882, CPU – 16890) |
| Uniengine Superposition – 1080p Extreme | 13133 | 12796 | 12641 | 13700 |
| CineBench R23 (best run) | 34075 cb – multi core, 1946 cb – single core |
34837 cb – multi core, 1934 cb – single core |
31664 cb – multi core, 2131 cb – single core |
29549 cb – multi core, 1988 cb – single core |
| Blender 3.01 – Classroom scene – CPU Compute | 2m 36s | 2m 30s | 3m 02s | 3m 21s |
| Blender 3.01 – Classroom scene – GPU Compute | 18.99s (CUDA), 12.26s (Optix); | 18.07s (CUDA), 12.21 (Optix) | 19.68s (CUDA), 13.51s (Optix) | 19.43s (CUDA), 12.97s (Optix) |
| PugetBench – Adobe Photoshop | 1326 | 1311 | 1274 | 1213 |
| PugetBench – DaVinci After Effects | 2143 | 2107 | 2007 | 1990 |
| SPECviewperf 2020 – 3DSMax: | 212.43 | 184.38 | 200.05 | 199.64 |
| SPECviewperf 2020 – Catia: | 103.83 | 103.76 | 112.91 | 111.44 |
| SPECviewperf 2020 – Maya: | 552.36 | 391.05 | 517.80 | 542.53 |
Keep in mind that I’ve tested these devices at different times, and the results of the regular Scar 17 and the Scar 18 might have slightly improved in the meantime, with more recent software and BIOS updates.
For the most part, though, these results showcase what to expect between these platforms when paired with an RTX 4090 Laptop dGPU.
Manual profile – Max settings and fans mode
We should also discuss some of the other available power profiles available for the Scar 17 X3D, particularly Manual and Silent.
Manual allows to max the CPU and GPU power on this laptop, as well as overclock the GPU and teak the fan curves. For this test, I maxed the CPU, kept the GPU on the default OC settings (+100 MHz Core, _+150 MHz Memory), and maxed-out both the CPU and GPU fans. Furthermore, I placed the laptop on a stand, in order to make sure the airflow of cool air into the fans is not impeded in any way.
And then ran some tests again. Here’s what we got:
- 3DMark 13 – CPU profile: max – 13501, 16 – 13072, 8 – 7568, 4 – 4141, 2 – 2160, 1 – 1086;
- 3DMark 13 – Fire Strike: 43540 (Graphics – 52923, Physics – 39832, Combined – 19881);
- 3DMark 13 – Port Royal (RTX): 14081;
- 3DMark 13 – Time Spy: 20866 (Graphics – 22548, CPU – 14669);
- Uniengine Superposition – 1080p Extreme: 13376;
- CineBench R20 (best run): CPU 13322 cb, CPU Single Core 758 CB;
- Blender 3.41 – Classroom scene – CPU Compute: 2m 29s
We’re looking at roughly 1-3% better scores in both the CPU and GPU tests. We’re also getting cooler internal temperatures, as you’ll see further down in the gaming section. But the fans are also running much louder, at 54+ dBA, vs 48 dBA on Turbo.
So for the most part, this Manual mode doesn’t make much sense, but I just wanted to see what can be squeezed out of this hardware configuration.
Silent profile – still excellent performance at sub 35 dBA
The Silent profile, however, is truly impressive on this laptop.
Here are some results:
- 3DMark 13 – CPU profile: max – 12858, 16 – 12546, 8 – 7138, 4 – 3859, 2 – 2030, 1 – 1039;
- 3DMark 13 – Fire Strike: 39878 (Graphics – 48499, Physics – 36087, Combined – 18330);
- 3DMark 13 – Port Royal (RTX): 12411;
- 3DMark 13 – Time Spy: 16955 (Graphics – 19465, CPU – 9797);
- Uniengine Superposition – 1080p Extreme: 10342;
- CineBench R20 (best run): CPU 11420 cb, CPU Single Core 742 CB;
And a few work tests.
- Blender 3.41 – Classroom scene – CPU Compute: 3m 33s;
- PugetBench – Adobe Photoshop: 1224;
- PugetBench – Adobe Premiere: 858;
On the CPU side, the 65W power cap translates in the Ryzen 9 7945HX3D returning roughly 70-75% of its performance on the higher-power profiles.
And on the GPU side, the performance is about 80-85% in this mode.
Furthermore, in real-life multitasking and workloads, the performance delta between Silent and Turbo modes varies between 80% to 95%.
More importantly, though, this Silent profile keeps the fans quiet, at sub 35 dBA, and keeps the internal and external temperatures at bay as well. So that means this Scar 17 X3D provides one of the best performance and experiences available on any laptop at such quiet settings.
Gaming performance
Let’s get to where the 3D processor should really make the difference: gaming.
We tested a couple of different types of games on the various available profiles at QHD and FHD resolution, all with the MUX set on the Ultimate GPU mode. Just keep in mind that this laptop comes with a 16:9 display, and not the 16:10 models available on most of the other 2023 performance laptops, so the system has to push out roughly 10% fewer pixels.
Here are the results:
| Ryzen 9 7945HX3D + RTX 4090 Laptop 150-175W |
QHD Turbo, Ultimate, on desk |
QHD Performance, Ultimate, on desk |
FHD Turbo, Ultimate, on desk |
FHD Silent, Ultimate, on desk |
| Cyberpunk 2077 (DX 12, Ultra Preset, RTX OFF) |
109 fps (78 fps – 1% low) | 101 fps (58 fps – 1% low) | 153 fps (85 fps – 1% low) | 109 fps (67 fps – 1% low) |
| Doom Eternal (Vulkan, Ultra Preset) |
392 fps (98 fps – 1% low) | 357 fps (84 fps – 1% low) | 502 fps (46 fps – 1% low) | 404 fps (66 fps – 1% low) |
| Far Cry 6 (DX 12, Ultra Preset, TAA) |
139 fps (100 fps – 1% low) | 134 fps (100 fps – 1% low) | 150 fps (103 fps – 1% low) | 134 fps (96 fps – 1% low) |
| Far Cry 5 (DX 11, Ultra Preset, SMAA) |
198 fps (117 fps – 1% low) | 183 fps (108 fps – 1% low) | 211 fps (144 fps – 1% low) | 196 fps (132 fps – 1% low) |
| Metro Exodus (DX 12, Ultra Preset, RTX OFF) |
123 fps (78 fps – 1% low) | – | 140 fps (82 fps – 1% low) | – |
| Red Dead Redemption 2 (DX 12, Ultra Optimized, TAA) |
160 fps (93 fps – 1% low) | 148 fps (88 fps – 1% low) | 195 fps (112 fps – 1% low) | 157 fps (86 fps – 1% low) |
| Resident Evil 4 (DX 12, Prioritize Graphics, TAA) |
162 fps (97 fps – 1% low) | 144 fps (86 fps – 1% low) | 224 fps (116 fps – 1% low) | 198 fps (91 fps – 1% low) |
| Shadow of Tomb Raider (DX 12, Highest Preset, TAA) |
196 fps (126 fps – 1% low) | 181 fps (108 fps – 1% low) | 234 fps (112 fps – 1% low) | 181 fps (102 fps – 1% low) |
| The Witcher 3: Wild Hunt (v4.04) (DX 12, Ultra Preset, TAAU) |
141 fps (72 fps – 1% low) | 137 fps (64 fps – 1% low) | 148 fps (76 fps – 1% low) | 123 fps (46 fps – 1% low) |
- Battlefield V, Cyberpunk, Doom, Resident Evil, Witcher 3 – recorded with Fraps/in-game FPS counter in campaign mode;
- Far Cry 5, 6, Metro, Red Dead Redemption 2, Tomb Raider – recorded with the included Benchmark utilities;
- Red Dead Redemption 2 Optimized profile based on these settings.
Those above are rasterization tests, and here are some results for RTX – Ray Tracing performance, with and without DLSS.
| Ryzen 9 7945HX3D + RTX 4090 Laptop 150-175W | QHD Turbo, Ultimate, on desk | FHD Turbo, Ultimate, on desk |
| Cyberpunk 2077 (DX 12, Ultra Preset + RTX, DLSS Off) |
47 fps (39 fps – 1% low) | 120 fps (82 fps – 1% low) |
| Cyberpunk 2077 (DX 12, Ultra Preset + RTX, FSR + DLSS Balanced) |
115 fps (92 fps – 1% low) | 165 fps (123 fps – 1% low) |
| Doom Eternal (DX 12, Ultra Preset, RTX On, DLSS Off) |
269 fps (162 fps – 1% low) | 367 fps (266 fps – 1% low) |
| Doom Eternal (DX 12, Ultra Preset, RTX On, DLSS Quality) |
314 fps (194 fps – 1% low) | 411 fps (173 fps – 1% low) |
| Far Cry 6 (DX 12, Ultra Preset + DXR reflections / shadows) |
121 fps (90 fps – 1% low) | 125 fps (94 fps – 1% low) |
| Shadow of Tomb Raider (DX 12, Highest Preset, TAA, RTX Ultra, DLSS Off) |
128 fps (75 fps – 1% low) | 166 fps (85 fps – 1% low) |
| The Witcher 3: Wild Hunt (v4.04) (DX 12, Ultra Preset, TAAU) |
135 fps (72 fps – 1% low) | 156 fps (83 fps – 1% low) |
| The Witcher 3: Wild Hunt (v4.04 update) (DX 12, RT Ultra Preset, TAAU, DLSS3 Off) |
97 fps (59 fps – 1% low) | 107 fps (68 fps – 1% low) |
| The Witcher 3: Wild Hunt (v4.04 update) (DX 12, RT Ultra Preset, DLSS3 On) |
124 fps (85 fps – 1% low) | 161 fps (105 fps – 1% low) |
This configuration can easily handle all modern games at QHD resolution and Ultra settings.
Gaming comparison – R9-7945HX3D, R9-7945HX, i9-13900HX
Let’s see how this Ryzen 9 7945HX3D + RTX 4090 configuration fares in games against two other top-tier configurations:
- AMD Ryzen 9 7945HX + RTX 4090 175W in the regular Scar 17;
- Intel Core i9-13900HX + RTX 4090 175W in the Legion Pro 7i.
The reason I’ve included the Legion is here and not the ROG Scar 18 with the faster i9-13980HX processor is the fact that it’s been a few months since our review of the Scar 18, and some results might have changed with the more recent software updates. I didn’t have a Scar 18 to retest with recent software, which would have made the most sense for this comparison, but perhaps I will get one for a separate article.
| ROG Scar 17, Ryzen 9 7945HX + RTX 4090 175W, QHD Turbo, dGPU, on desk |
ROG Scar 17, Ryzen 9 7945HX + RTX 4090 175W, QHD Turbo, dGPU, on desk |
Legion Pro 7i 2023, Core i9-13900HX + RTX 4090 175W, QHD+ Performance, dGPU, on desk |
|
| Cyberpunk 2077 (DX 12, Ultra Preset, RTX OFF) |
109 fps (78 fps – 1% low) | 108 fps (77 fps – 1% low) | 98 fps (68 fps – 1% low) |
| Cyberpunk 2077 (DX 12, Ultra Preset + RTX, DLSS3 Off) |
47 fps (39 fps – 1% low) | 49 fps (37 fps – 1% low) | 43 fps (28 fps – 1% low) |
| Cyberpunk 2077 (DX 12, Ultra Preset + RTX, DLSS3 Balanced) |
115 fps (92 fps – 1% low) | 139 fps (113 fps – 1% low) | 128 fps (68 fps – 1% low) |
| Far Cry 6 (DX 12, Ultra Preset, TAA) |
139 fps (100 fps – 1% low) | 109 fps (82 fps – 1% low) | 125 fps (88 fps – 1% low) |
| Red Dead Redemption 2 (DX 12, Ultra Optimized, TAA) |
160 fps (93 fps – 1% low) | 136 fps (88 fps – 1% low) | 134 fps (47 fps – 1% low) |
| Resident Evil 4 (DX 12, Prioritize Graphics, TAA) |
162 fps (97 fps – 1% low) | – | 154 fps (60 fps – 1% low) |
| Shadow of Tomb Raider (DX 12, Highest Preset, TAA) |
196 fps (126 fps – 1% low) | 162 fps (101 fps – 1% low) | 162 fps (92 fps – 1% low) |
| The Witcher 3: Wild Hunt (v4.04) (DX 12, Ultra Preset, TAAU) |
141 fps (72 fps – 1% low) | – | 133 fps (80 fps – 1% low) |
| The Witcher 3: Wild Hunt (v4.04 update) (DX 12, RT Ultra Preset, TAAU, DLSS3 Off) |
97 fps (59 fps – 1% low) | – | 89 fps (53 fps – 1% low) |
| The Witcher 3: Wild Hunt (v4.04 update) (DX 12, RT Ultra Preset, DLSS3 On) |
124 fps (85 fps – 1% low) | – | 103 fps (48 fps – 1% low) |
I’ve tested Witcher 3 on an earlier patch on the regular Scar 17, and the results are not consistent between patches. Hence, I didn’t include them in here. I will update the table if possible.
Either way, the Ryzen 9 7945HX3D configuration shows a notable increase in framerates in some titles, both over the regular Ryzen 9 7945HX configuration, but also over the Intel-based model. Just don’t forget the Lenovo runs a 16:10 QHD+ configuration.
However, not all titles showcase an advantage for the 3D AMD processor, as shown in Cyberpunk 2077. In most titles, though, the Scar 17 3D meets the expectations and is the most powerful gaming notebook of this generation.
I’ve also included Jarrod’s video down below, as he goes over a few more games on the Ryzen 9 7945HX3D, Ryzen 9 7945HX and Intel Core i9-13980HX ROG Scar configurations.
With that out of the way, let’s go over some performance and temperature logs for this Scar 17 X3D.
The Turbo mode ramps up the fans to levels of ~48 dB, which is fine for this sort of a laptop on the top-performance profile
With the laptop on the desk, the CPU runs at ~45W of power and stabilizes at around 88 to 90 degrees Celsius, which is the same temperature limited noticed in our Cinebench loop test. The GPU, on the other hand, runs at 76-78 degrees Celsius between the tested games.
Those CPU temperatures are high, but not necessarily as high as on other modern laptop, and the GPU temperatures and performance are excellent here.
Once we raise the back of the laptop off the desk in order to improve the airflow of fresh air into the fans, the CPU runs at slightly higher power and the same 88-90 degrees Celsius power limit, while the GPU stabilizes at around 72-73 C. Hence, I would surely recommend palcing the laptop on a raiser stand with long gaming sessions, as this helps with keeping the components cooler, while also allowing the CPU to run at slightly higher power and frequencies.
You could also opt for the Manual profile which allows customizing the power setting and fan profiles. For testing, I’ve pushed both fans to 100% rpms and pushed the CPU limits tot their max, while keeping the GPU OC settings default. The CPU still ends up thermally limited at 88 C, but not runs at even higher power then on Turbo, while the GPU runs even cooler, but the performance is not impacted in any way.
For these logs, I’ve kept the laptop on the raiser stand, making sure the fans are not choked in any way.
If you’re willing to sacrifice the framerates to some extent in order to get a quieter gaming experience, the Performance and Silent profiles are worth pursuing.
On our unit, the Performance profile drops the fans’ noise to ~43-44 dBA at head level, and marginally limits the CPU and GPU power. This translates into a ~10% reduction in framerates. The temperatures remain comparable to the Turbo mode.
Here’s what we got with the laptop on the desk.
And here’s what happened when placing it on the raiser stand, on the same Performance mode.
The Silent profile caps both the CPU and GPU more aggressively, but also keeps the fan noise low at around 35 dBA at head-level. The GPU ends up running at around 95-100W of power, which allows for 70-80% of the framerates possible on Turbo. That’s excellent fro this sort of profile, and a notable improvement from the previous AMD Scars that we’ve tested.
CPU and GPU temperatures are kept at bay as well, with the CPU averaging around 85 C and the GPU around 75 C, both with the laptop flat on the desk. Bump it on a stand and those temperatures will drop by a few degrees.
Finally, I omitted to test the gaming performance on battery power on this unit, so I can’t share anything about that.
Noise, Heat, Connectivity, speakers, and others
Asus implements a dual-fan quad-radiator thermal module on this laptop, with a massive vapor chamber over the CPU/GPU, two extra additional heatpipes going into the side vents, and Conductonaut Extreme liquid metal compound on both the CPU and GPU.
This below is the thermal module on the regular Scar 17 2023, but it is identical on the Scar 17 X3D as well.
")
This is a more standard implementation than the newer tri-radiator design offered with the 2023 ROG Scar 16 and 18 models. It is well suited for this hardware configuration, although it could do a better job on the CPU side.
As it is, the system limits the CPU power in order to prevent it from going over 90 degrees Celsius. Furthermore, with the fresh air coming from the bottom of the laptop, the cooling module benefits from placing this computer on a stand, in order to allow for more space underneath the chassis. This allows for higher CPU sustained power and lower GPU temperatures compared to using the laptop flat on a desk.
With that out of the way, here’s a quick recap on the fan noise on the available power profiles as per the current software: 53+ dBA on Manual with max fan, 48 dBA on Turbo, ~44 dBA of Performance, and sub-35 dBA on the Silent profile.
As far as the outer case temperatures go, the armrest and the areas around the WASD keys and arrows barely go over 30 degrees Celsius, so this laptop never feels hot to the touch. However, there are hotspots above the keyboard and on the back of the chassis, which can go close and even over 50 degrees C; but you’re not going to come in contact with those with everyday use.
Keep in mind that I’ve recorded these FLIR images with the laptop sitting on the desk, and they’ll drop a little bit if you place the laptop on a raiser stand.
")
")
")
*Gaming – Silent – playing Cyberpunk for 30 minutes, Silent profile, fans at ~35 dB
*Gaming – Performance – playing Cyberpunk for 30 minutes, fans at ~44 dB
*Gaming – Turbo, on desk – playing Cyberpunk 2077 for 30 minutes, fans at ~48 dB
Here’s what we got in comparison on Manual mode with the fans at max and the laptop placed on a stand.
")
*Gaming – Manual, raised back – playing Cyberpunk 2077 for 30 minutes, fans at ~54 dB
Gaming aside, this laptop runs quietly with light multitasking, browsing, or video streaming, but only idles with the lightest of loads.
The 0dB Technology allows the fans to completely switch off with light use on the Silent profile, as long as the hardware stays under 60 C, but with daily multitasking, the AMD CPU spikes above that limit, and thus both fans become active. They spin quietly, though, at sub 25 dBA.
I haven’t noticed any coil whining or electronic noises on this sample, but that’s no guarantee you won’t on your unit. So make sure to listen for any inconsistencies.
")
*Daily Use – streaming Netflix in EDGE for 30 minutes, Silent profile, fans at 0-30 dB
For connectivity, there’s Wireless 6E and Bluetooth 5 on this unit, with a triple-band implementation, as well as 2.5G wired Internet. This sample performed well on Wi-Fi with my setup.
The audio quality here is pretty good for laptop speakers, although there are only two main speakers on this model, firing through the grills on the bottom of the laptop, without the two extra tweeters firing through the small grills under the display that were implemented on the 2022 Scar models. The sound is still fairly rich and with some bass, as well as loud at 80+ dB at head level. I also haven’t noticed any distortions at high levels, but the armrest vibrates a bit at volumes over 70%.
Finally, a camera is placed at the top of the screen and flanked by microphones. It’s HD resolution, so not much in terms of quality (especially in bad lighting), and doesn’t include IR for Windows Hello.
Battery life
There’s a 90Wh battery inside all the 2023 ROG models, including this Strix Scar 17 X3D.
The system is set to automatically switch the screen’s refresh to 60 Hz when using the laptop on battery power, so if you’ll notice a quick screen flicker when you disconnect the laptop from the wall, that’s a side-effect of this tweak.
Here’s what we got on our review unit in terms of battery life, with the laptop on the Standard GPU mode and the screen brightness at around 120 nits (~50% brightness).
- 25 W (~4 h of use) – text editing in Google Drive, Silent Mode, screen at 50%, WiFi ON;
- 28 W (~3-4 h of use) – 4K fullscreen video on Youtube in Edge, Silent Mode, screen at 50%, WiFi ON;
- 25 W (~4 h of use) – Netflix 4K HDR fullscreen in Edge, Silent Mode, screen at 50%, WiFi ON;
- 30 W (~3-4 h of use) – browsing in Edge, Silent Mode, screen at 50%, WiFi ON;
- 95 W (<1 h of use) – Gaming – Witcher 3, Performance Mode, screen at 50%, WiFi ON, no fps limit.
That’s not much, especially with streaming and light use. At the same time, these results are on par with what we got on the regular Ryzen 9 7945HX implementations reviewed earlier in the year.
For comparison, here’s what we got on the Intel-based ROG Scar 18.
- 14 W (~5-6 h of use) – text editing in Google Drive, Silent Mode, screen at 60%, WiFi ON;
- 15 W (~5-6 h of use) – 1080p fullscreen video on Youtube in Edge, Silent Mode, screen at 60%, WiFi ON;
- 15 W (~5-6 h of use) – Netflix 4K HDR fullscreen in Edge, Silent Mode, screen at 60%, WiFi ON;
- 22 W (~4-5 h of use) – browsing in Edge, Silent Mode, screen at 60%, WiFi ON;
- 75 W (~1+ h of use) – Gaming – Witcher 3, Performance Mode, screen at 60%, WiFi ON, no fps limit.
The Scar 18 lasts a fair bit longer with every sort of load. Hence, the HX Ryzen platform is surely not designed for efficiency on battery use.
I’ll also add that the 2023 ROG Strix Scar 17 comes with a 330W power brick on all models, which is quite large and heavy. The battery fully charges from 10% in about 2 hours, with fast charging for the first half an hour, and USB-C charging is supported, up to 100W.
You won’t be able to use the laptop on Turbo/Manual while hooked over USB-C, but that’s enough for everyday multitasking and occasional heavy workloads on Performance, in case you don’t want to bring along the heavier main brick when on the go.
")
Price and availability- 2023 Asus ROG Strix Scar 17 X3D
The 2023 Asus ROG Strix Scar 17 X3D is listed in some markets at the time of this article.
There’s a single configuration available, the Scar 17 G733PYV model reviewed here, which pairs the AMD Ryzen 9 7945HX3D CPU with the Nvidia RTX 4090 Laptop dGPU, as well as 32 GB of RAM and 1 TB of SSD storage, for an MSRP price of $3699 in the US and 3499 EUR in Europe.
In comparison, the regular Scar 17 7945HX + RTX 4090 configuration goes for 3.5K USD, and RTX 4080 configurations are available as well, for less than 3K.
That makes the Scar 17 X3D the most expensive Scar of this generation, even more expensive than the Scar 16 and Scar 18 which at this point are available with some slight discounts. It’s also one of the more expensive RTX 4090 laptops on the market.
Follow this link for updated configurations and prices in your region at the time you’re reading this article.
Final thoughts- 2023 Asus ROG Strix Scar 17 X3D review
If gaming is what you’re primarily after in a mobile computer, this Asus ROG Scar 17 X3D is the fastest option money can buy today. It’s as simple as that.
The 3D V-Cache on the AMD Ryzen 9 7945HX 3D processor makes a difference in many games, although not necessarily in every game. And the gains diminish at higher resolutions and with Ultra graphics settings, especially in comparison to some of the Intel-based models out there.
On top of that, the AMD platform with its 16C/32T design retains an advantage in CPU-heavy loads over the Intel HX models, although if that’s what you’re after, the regular Ryzen 9 7945HX configurations should also be considered.
As a whole, though, this Scar 17 X3D is worth the $200 extra that Asus demands for it over the regular Scar 17, again, if gaming is what you’re primarily interested in.
However, we can’t look past the fact that this Scar 17 chassis is a previous-generation design and doesn’t offer all the bells and whistles available with the 2023 Scar 18 chassis. It also fails to meet some of my expectations when it comes to its design and ergonomics.
And when you add up the fact that this Scar 17 X3D is more or less the same price as a top-tier Scar 18 these days, well, the odds aren’t always going to be in its favor. If gaming performance is all you care about, sure, you’ll go with the Scar 17 X3D, but if other aspects matter as well, such as having a brighter and bigger display, a cleaner design and even longer runtimes on battery power, the Scar 18 might win you over.
On top of these, there are a handful of other high-performance laptops with similar RTX 4090 specs that sell for a fair bit less. And that alone might make the difference for some of you.
Long story short, the AMD Ryzen 9 7945HX3D delivers on its promise, but I’d want to see it implemented in more products. For now, the Scar 17 X3D has exclusive access to this hardware, and that’s enough to earn it our recommendation for a powerful gaming laptop. But not that much for a powerful all-purpose mobile computer.
So there you have it, these are my thoughts on the 2023 Asus ROG Strix Scar 17 X3D series and the AMD Ryzen 9 7945HX3D hardware. Let me know what you think about these down below in the comments section.
")